Get to know your linux-system - Step 1
In this lesson I wanna show you a command, that gives you with just two keystrokes a load of useful information about a linux system.
What you can expect
In this lessen I will talk about
- The one command I always type in at first after logging in into a system.
- The current time and the timezone your system is configured with
- How to find out, if your system is currently overloaded or not
- If there are other users active on the system and what they are doing
(Yes - linux is a multi-user environment. And therefore it’s often very useful to see, what other users are doing on the system at the time you are working there.)
The command with the probably most useful information per keystroke
The command I am talking about here is the command “w”.
This command is the command I personally call every time at first if I have just logged in into a system. (typically remote via ssh)
How does the output of this command looks like?
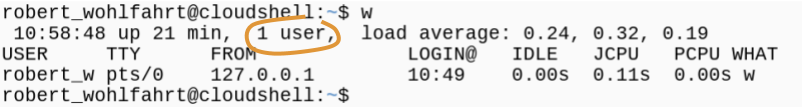
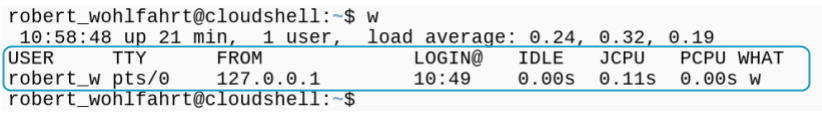
If you run the “w” command, it will give you at least three lines of output:
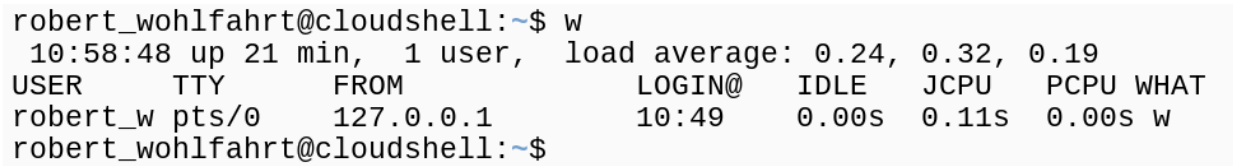
It will give you some more lines, if there are other users currently working on this system. But if you are currently the only user - then you’ll see exactly such 3 lines.
The first line tells you about the current state of the system
The first line of the output gives you a bunch of useful information about the current state of the system.
The second line is the headline for the table that is formed by all the remaining lines. This “current users table” gives you a lists of all currently logged in users and what they are doing right now.
Ok - so let’s start interpreting the output with the first line:
The first line starts with the current time
The current time - as the system knows it
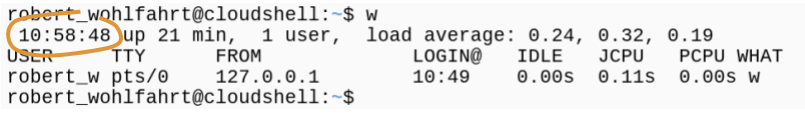
… corresponding to the timezone that is set for the system or for your environment.
This gives you not only the information on your progress of the day ;-) but it gives you also a good hint, if the system runs with the current time or if the time is simply somewhat out of sync.
This is especially useful if you later on
- examine log-files or perhaps
- you rely on timestamps of files …
Double-check the date, time and timezone
If you wanna double check the time or - much more important - the timezone the system uses: then simply call another command - the command date.
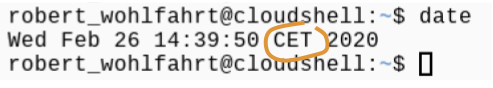
The date command shows you - beside the system-time - the current date and the timezone your system is currently configured with.
Ok - but back to the “w” command …
Have a look the current uptime
After the current time, the first line shows you a second time field: the current uptime.
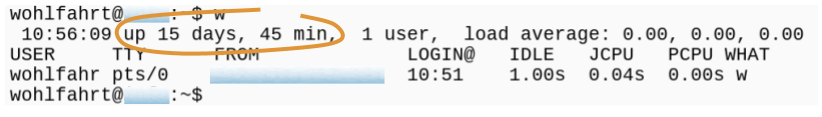
This field could say for instance something like “up 21 minutes” - or “up 15 days and 45 minutes”.
This info gives you a good feeling about the - I would say - “freshness” of the system. You’ll see, if the system has just booted up or if it runs for quite some time.
If I’m on a system, where I for instance see an uptime of several hundred days …
… yes - I’m not kidding. I’m regularly seeing in customers environments systems with uptimes of more than a year …
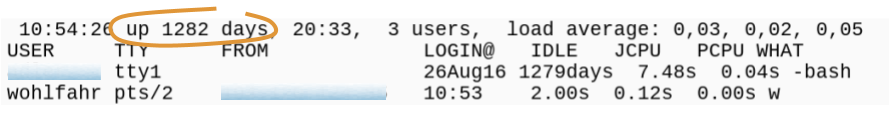
and if I see this on a system, than I know, that this system has very probably not received security-patches in regular intervals.
Because security patches from time to time also patches the kernel. And patching the kernel typically needs a reboot of the system …
(unless you are on a really modern and perfect configured system, that supports the live-patching for the kernel … yes - there are such systems …)
So - although such a huge uptime demonstrates the incredible stability of Linux-systems, it typically is also most of the time a sign for a not so good maintenance.
The number of currently active users
So the first line of the w command shows us the time, the uptime and then - in the third field - it gives us the information of how many users are currently active on this system.
Let’s skip this field for a minute and let’s have a look at the last field of this first line …
The Load Average shows you the load of the system
This last field gives you the information about the load the system is currently under.
So let’s have a look: The load-average on linux systems always consists of three values. And to be more exact - it consists of three average values
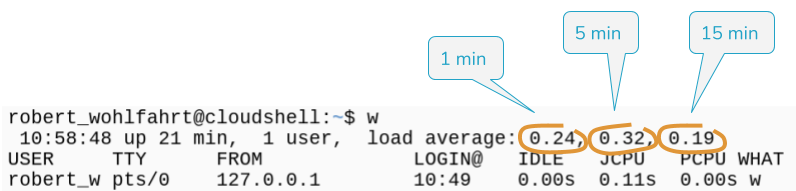
we have
- The average for the last minute,
- the average for the last 5 minutes, and
- the average for the last 15 minutes.
These values are often referenced to as load1, load5 and load15.
But what’s the meaning of these values … ?
The kernel (which is the main component of every system) observes, how many processes want to do something.
You have to understand, that a typical process (or program if you like) on your system, most of the time does nothing.
it does nothing but
- waiting for input, or
- waiting for data over the network, or
- waiting for a certain time to do something, or
- waiting for anything else …
and then - after waiting - the process does the things it needs to do.
And than it waits again …
And the kernel regularly counts the number of processes that currently really want to do something.
Everytime the kernel feeds the cpu with some work from a single progress …
… the kernel takes the number of all processes that currently want to run - and it calculates these three averages:
- one average number for the last minute (load1)
- one average number for the last 5 minutes (load5)
- and one for the last fifteen minutes (load15)
So if - for instance - we had a process active that wants to run and run and run … for instance an endless loop without any waiting inside:

then the kernel would always see as a minimum this one process as a process that wants to run.
And therefore, all these three average numbers will go up to one:
Obviously first the one-minute average,
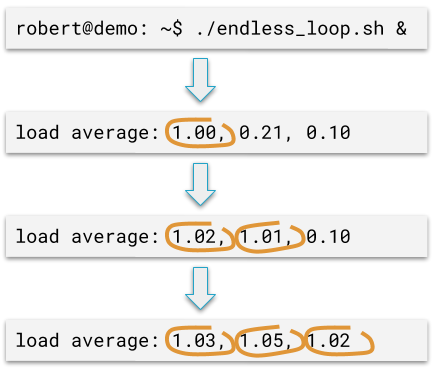
later on the 5 minutes average and at last the average for the 15 minutes.
But what do these numbers tell you about your system?
Well - first you will see, if the current load of the system is the same for the last 15 minutes or not.
if all averages - 1 minute, 5 minutes and 15 minutes are roughly the same, than you know that the load you are observing currently is somewhat constant - at least over the last 15 minutes
constant load: (hi Captain Obvious)

If they are not the same - then of course - you can see if the load of your system is currently going up or down.
If the current load - or the 1 minute average load - is much higher than the average from the last 15 minutes, then you know that you are observing a sudden higher load.
a load that currently lasts shorter than 15 minutes:

The other way around: If the 1 minute average is significant lower than the 15 minute average, than you are currently observing the system during a cooldown period:

… the load of the system is currently going down.
That leaves us with the question:
Is our system currently “overloaded”?
… or is it … hmm … bored and has not much to do.
Well - for this we need to know:
-
how many processes can our system run in parallel … ?
-
…without slowing them down.
As a simple rule of thumb:
A system can run as many processes in parallel, as it has cpu-cores
… without slowing them down.
So if you have a single processor-system - a system with a single processor that has only one single core - than this system can run only one single process at any given time.
Sure, it can run multiple processes in parallel. But then these processes have to share the single cpu and therefore they will be slowed down.
If you have a system with two cpu-cores …
it doesn’t matter if you have:
- 1 cpu with two cores or
- 2 cpus with one single core each
then your system can run 2 processes simultaneously without a slowdown.
And obviously
- a quad-cpu system can run up to four processes and
- a system with 8 cores can run up to 8 processes in parallel
… without slowing them down.
So - with this in mind, we can
Assess the load average we see
… if we know the number of cpu-cores the system has.
If the load is higher the than the number of cores (the most important value here is the 15 minutes average), then we know, that our processes run slower than they would with enough cpu-cores.
Simply spoken: our system is currently overloaded.
Don’t get me wrong:
The load-average (the 1 minute or the 5 minute values) can surely be way above the number of cpus -without seeing a problem:

a single core-system could have a 1 minute load of - for instance - 25 or so.
But if you see a constant high load (the 15 minutes value) - than either something on your system gets out of hand - or you simply have to add more cpus to handle all the needed tasks.

But what if you don’t know the number of cores your system has?
Than you can simply have a look into a special file, where the kernel gives you the information it has about every cpu-core. You simply have to count the cores you see within this file.
The name of the special file is /proc/cpuinfo. And the most simple way to get the information from this file is with the cat command.
cat /proc/cpuinfo
This prints out a block of information for every cpu the kernel sees:
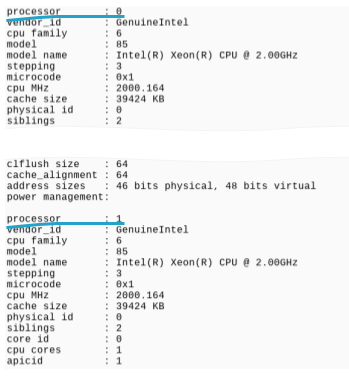
And you simply have to count these blocks to get the number of the cpu-cores your system has.
And with this number at hand - you can now say together with the load average - if your system is currently under high load or not.
Phew - that was a lot of information - only about the first line of the output of the command “w”.
So let’s summarize the first line of “w”
- We have the current time
- we have the uptime
- we have the number of active users
- and we have the load average.
This leaves us with the number of active users:
And here, the most interesting information isn’t the number of users itself, but …
what are this users doing right now?
This information can be read from the other lines of the output of “w”.
All output lines but the first one build a table of currently logged in users.
The current users table:
The headline of this tables shows you the values you can expect within the columns and every line below the headline shows the information for one single logged in user.
-
You see the name of the user (the login-name)
-
The column FROM shows you, if the user is connected over the network or not.
If connected over the network (typically via ssh or putty), you will see here the IP address or the name of the host from where the user is connected.
-
The next column with the header “LOGIN@” gives you the login-time
-
And - this is the column I always have a look at if I’m not the only one working on the system - this is the column named “IDLE”.
The value there shows you, if the user is currently really working on the system or if he hasn’t anything typed in for the last - let’s say - 4 hours or so.
From time to time a come across a system, where I see another user logged in - not just me
And this other user has an idle time of multiple days:
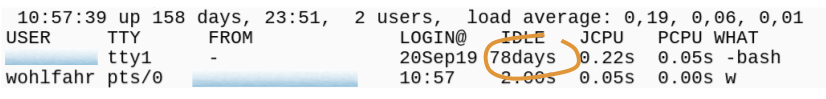
Then I know, this user isn’t really doing something at the system. But he has simply forgotten so logout.
This typically can happen, if the user has logged in directly at the console (not via ssh or putty) - and then he simply walked away.
He leaved the system without closing his shell!
And finally the last column …
… the column with the headline “WHAT”:
- This column shows you the command that is currently run by the shown user.
The line that contains your current-session will simply show here the “w” command.
So: If you are alone on the system, then the output of “w” will show you only one single line for an active user session - the line for your current session.
And if there are other users active on the system,you will recognise this directly after calling the “w” command.
So as a conclusion:
if you wanna know something about the system you are currently on - use this short command “w” - to get the most information for your keystrokes …
I hope you enjoyed this post.
See you next time
Here is what to do next

If you followed me through this article, you certainly have realized that knowing some internals about how things are working at the Linux command line, can save you a lot of time and frustration.
And sometimes it’s just fun to leverage these powerful mechanics.
If you wanna know more about such “internal mechanisms” of the Linux command line - written especially for Linux beginners
have a look at “The Linux Confidence Framework”
In this framework I guide you through 5 simple steps to feel comfortable at the Linux command line.
This framework comes as a free pdf and you can get it here.
Wanna take an unfair advantage?

If it comes to working on the Linux command line - at the end of the day it is always about knowing the right tool for the right task.
And it is about knowing the tools that are most certainly available on the Linux system you are currently on.
To give you all the tools for your day-to-day work at the Linux command line, I have created “The ShellToolbox”.
This book gives you everything
- from the very basic commands, through
- everything you need for working with files and filesystems,
- managing processes,
- managing users and permissions, through
- software management,
- hardware analyses and
- simple shell-scripting to the tools you need for
- doing simple “networking stuff”.
Everything in one single, easy to read book. With explanations and example calls for illustration.
If you are interested, go to shelltoolbox.com and have a look (as long as it is available).