Get to know your linux-system - Step 2
In this second step of “Get To Know Your Linux-System” you will learn more about the CPU- and memory-load of your system.
What you will get
- We will have a look at the processes a system is currently busy with
- You will see, how much memory a system has installed and how it is used
- You will get the insight, if your system, is slowed down because of a memory-overload.
… and incidentally, I will show you, how you can pause a process and reactivate it later on.
So let’s start with the single command, that prepares for you most of the needed information in one single view …
So - ok. Here we are - logged in into a linux system - staring at the blinking cursor within our terminal:
robert@demo:~$ _
And our goal is now, to get as much useful information about the system as we can get.
Get the first impression
Perhaps you know, what the first tool is that I start directly after logging in into a system?
Yes - it is the command “w”.
(If you wanna know about this command and the information it gives you, have a look at the lesson “Get to know your system- Step 1”. There I talk about everything related to this tool.)
Instead of the “w” - command - let’s talk here about another command.
Let’s talk about the command “top”
top is one of my favorites, if I wanna see what’s currently going on on a system and how the CPU and memory is loaded.
Let’s start top simply by entering “top” and hitting enter …
robert@demo:~$ top
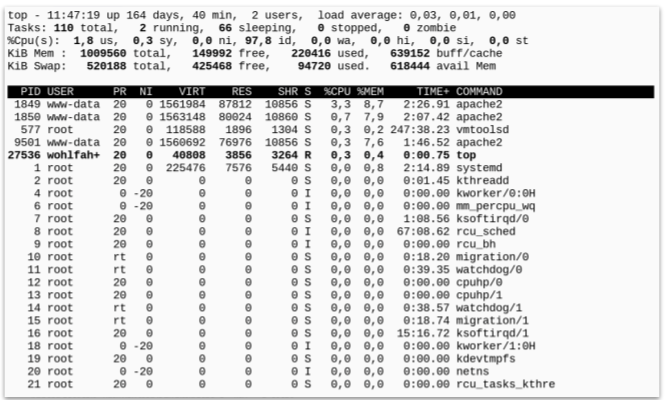
Top is a command, that immediately after start takes over the whole terminal. It displays a bunch of useful information and refreshes them every 2 seconds.
… and top does this until you stop it by hitting “q” - “q” as in “quit”.
But before leaving the top command again - let’s have a look at the information it gives us:
The main purpose of top is, to list the currently active processes sorted by the load they put on the system. This list is the table that occupies nearly the complete output-area of top.
A little bit more about this table in a few minutes.
Top gives a lot of status-data
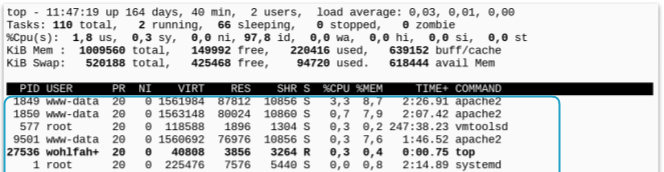
First let’s have a look at all the data the top command gives us above this table of processes. There we see 5 lines filled with useful information.
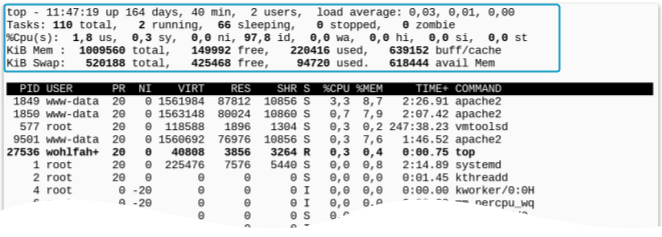
The first line is nearly the same line the w command would give us.
Here it starts with the phrase “top” - the name of the command itself. Then we have
- the current time
- the uptime
- the number of active user sessions
- and the load average - the 1 minute, the 5 minutes and the 15 minutes load.
(for a discussion of this information see the lesson “Get to know your system- Step 1”.
The number of processes and their state
The second line - starting with the phrase “tasks” - gives us an overview about how many processes (or tasks) are currently active on the system.
And we get the numbers of processes at each state a process can have:

So the first number is obviously the total number of processes or tasks - therefore the word “total“ (has Captain Obvious already arrived?)
Then we have the number of currently running processes. This gives you - in addition to the load-average - a quick insight into how much your system currently has to do:
-
If you are the only one active on the system and you just opened the shell and the top command, then chances are great, that you see here the number 1 . This is you even started “top” command as a process.
-
If you are - for instance - on a busy webserver, then the number of running processes would be typically higher.
And what about the other processes?
We have a total of - let’s say 110 processes - and only two are running.
What’s the purpose of the others?
Well - they are typically sleeping. The next number in the row.

On a real-world system you will recognize, that the vast majority of all processes are sleeping processes.
But this doesn’t mean they are useless. They are just waiting for the perfect time to do their work.
The webserver for instance is waiting for a request coming from the user. And only when this request comes in, it has to serve the requested website.
Or - let’s take the shell where you’ve logged in and started the top-command from:
This shell currently does nothing but waiting for you ending the top command, so that it can give you a fresh prompt waiting for your input …
But now: this shell is just sleeping - waiting for you to come back.
After the number of sleeping processes - we see two more numbers:

- stopped processes and
- huhuuuu … zombies!!!!
Stopped processes are processes that where marked as: “no - from now on this process doesn’t get any CPU-time”.
How to stop a process …
As a side -node: If you have started a process from the shell (like now for instance the top command) - and this process is running in the foreground (again like this top command), then you can stop this process from the shell by simply hitting “
Then the process in the foreground will immediately be stopped. You have your prompt back and can do some other work.
[1]+  Stopped                   top
robert@demo:~$ _
… and how to reactivate it later on
Later on - if you wanna reactivate the stopped process, use the tool fg - this stand for foreground - and the job-ID of the stopped process:
robert@demo:~$ fg 1
Typically this will be the number one (you first stopped process in this shell) - but if you are unsure - use the “jobs” command to get a list of all currently - from the shell observed processes and their given job-ids.
robert@demo:~$ jobs
[1]+  Stopped                   top
robert@demo:~$ fg 1
Back to the numbers …
The last number in the tasks row gives you the count of zombie-processes. This are processes in a transient state: They are terminated but not yet removed completely from memory …
Take this number just as an information …
What are the CPUs doing?
Let’s go on to the next line. The line labeled Cpu(s).
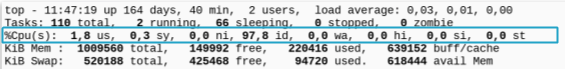
This line shows you exactly, what the CPUs have to do. And one interesting fact about this line is, that it can show you the number of CPUs the system has:
Show all CPUs separate …
If you simply hit [ 1 ] - the key with the number one - then this single line will expand to multiple lines - on line for each CPU.
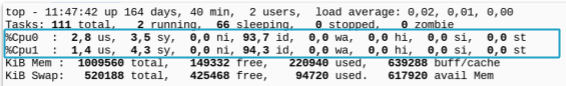
if you later on hit the [ 1 ] again - then all the single lines will collapse back to a single one, showing the averages over all available CPUs.
This is - I think - the fastest way you can get the number of available CPUs in your system: start “top” and hit [ 1 ].
What these numbers are telling us …
The numbers you see in this line let you dive really deep into the load of your system and give you information what’s going on here.
But for the sake of this lesson - let’s have a look only at the value with the label “id” which stands for idle.
This number - measured in percent - says:
“how many percent of the CPU-resources are currently unused”
… and therefore are “idle”.
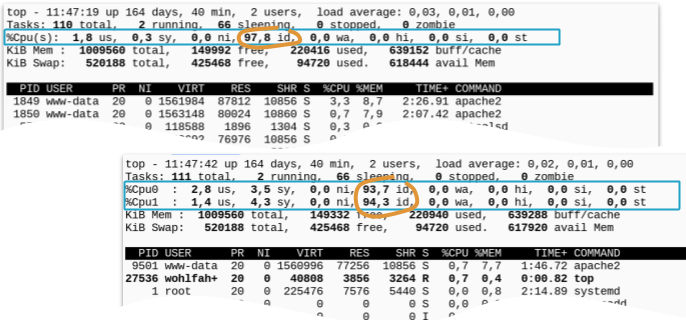
So if you see here any number greater than zero - then you know your system has resources left to handle additional processes …
This leaves us with the memory-resources
These are shown within the two lines below the CPU-information.
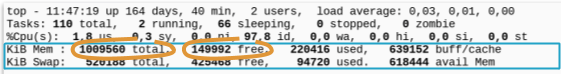
While the first line about the memory shows the information about the real - the physical ram …
… the second line shows the swap-space and its usage:
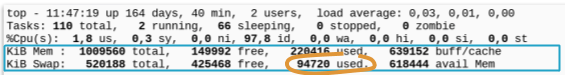
The swap-space is simply spoken space on a hard disk, that will be used by the system to swap-out memory, if the processes on the system needs more ram than it has really installed.
The first line on the other hand shows you the really installed ram. It shows you how much of it is used and the remaining free ram.
Don’t give too much about the used RAM or the free RAM shown here:
It doesn’t matter, how many RAM the system has installed - over the time it will use nearly all of them. For caching purposes and similar tasks ..
But have a look at the swap-usage
If the system constantly swaps a lot of memory out - than there is a high chance that the system is overloaded by memory and therefore the processes are slowed down.
Verify memory-overload with “waiting %”
If you wanna verify, if your system is really slowed down because the memory overload: have again a look at the CPU-numbers. More exact at the number labeled with wa - which stands for “waiting”.
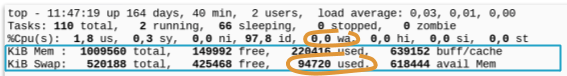
If the memory overload slows down the system, than this is because the time it takes to write memory-pages to the disk and read them in later on. This is called swapin and swapout.
And during swapin and swapout, the processes has to wait for their memory - (more precisely: it has to wait for disk-operations) and this can directly be observed via this waiting-part of the CPU-usage.
So if you see your system swapping, and this wait-percentage shows a number of let’s say - higher than 20% - then you know that your system is slowed down because of the memory overload.
If the wait-percentage is low - let’s say below 5 percent - then everything is fine. even if the system may be swapping …
now - if the system is overloaded by memory - You surely wanna know …
which processes are eating up all the memory?
Well - have a look at the process-table below the memory-information.
This table of processes is by default sorted by the CPU-load the processes generate:
But if you hit [ M ] - the uppercase M - than the process-list is sorted by its memory usage.
How much memory each process really consumes can be read from the column with the label “RES” - with stands for “resident”. This is a funny name for the memory that comes directly from the installed RAM:
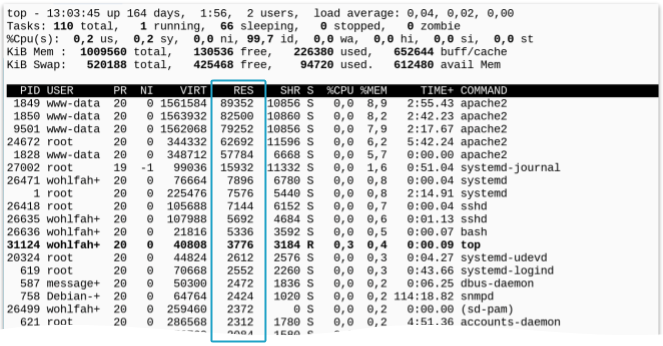
… in this way - you can identify your top memory-consumers very easily
If you wanna switch the sorting back to CPU-usage - hit the uppercase [ P ].
The table of processes
To finalize the overview over the top command - let’s have a look at some useful information we can get from the sorted table of processes:
-
first - the “PID“ is the process-id. Every process here has its very own number - so this is mostly the best way to address a single process later on. For instance to terminate it …
-
The column “USER” shows you, in which user-context a process currently runs. This gives you a good feeling about the permissions a process has
-
The last column “COMMAND“ is self explaining: this shows typically how a process was started. Yes - it means what command was used to start this process. But be prepared, that you won’t see any parameters here …
-
And lastly the column “TIME“: this shows you how much CPU-time a process has consumed from its start until now.
Everytime a process wants to do something - it wants to run - the the time is measured, for how long the process occupies the CPU. And this time is added up during the complete life of the process.
So if you see a process here, consuming currently a lot of CPU-resources (it stands at the top of the default process-table) and you see at the same time a high number in the column TIME - than you know that the process was also responsible for a lot of CPU-load in the past.
You see - the top command gives you a lot of useful information about the current state of the system and about it’s CPU and memory load and - if it is overloaded by CPU or memory - you can see where the load is coming from.
I hope you enjoyed this lesson. See you next time
Robert
Here is what to do next

If you followed me through this article, you certainly have realized that knowing some internals about how things are working at the Linux command line, can save you a lot of time and frustration.
And sometimes it’s just fun to leverage these powerful mechanics.
If you wanna know more about such “internal mechanisms” of the Linux command line - written especially for Linux beginners
have a look at “The Linux Confidence Framework”
In this framework I guide you through 5 simple steps to feel comfortable at the Linux command line.
This framework comes as a free pdf and you can get it here.
Wanna take an unfair advantage?

If it comes to working on the Linux command line - at the end of the day it is always about knowing the right tool for the right task.
And it is about knowing the tools that are most certainly available on the Linux system you are currently on.
To give you all the tools for your day-to-day work at the Linux command line, I have created “The ShellToolbox”.
This book gives you everything
- from the very basic commands, through
- everything you need for working with files and filesystems,
- managing processes,
- managing users and permissions, through
- software management,
- hardware analyses and
- simple shell-scripting to the tools you need for
- doing simple “networking stuff”.
Everything in one single, easy to read book. With explanations and example calls for illustration.
If you are interested, go to shelltoolbox.com and have a look (as long as it is available).